
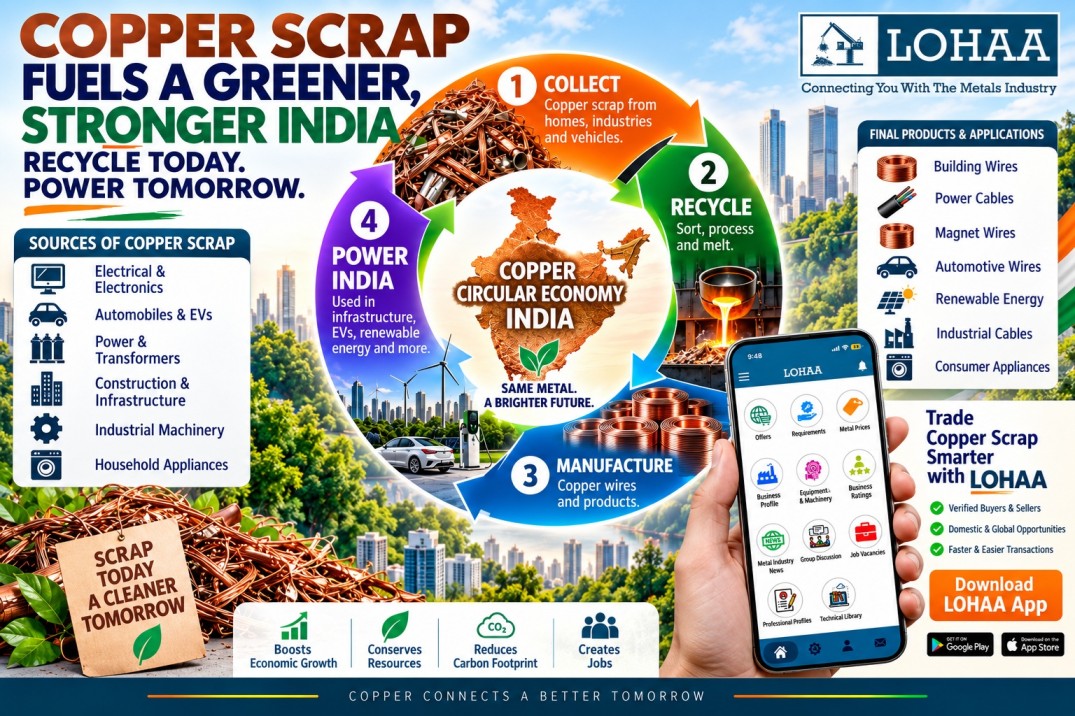
India Copper Scrap Market 2026 | Recycling, Imports & Wire
Copper Scrap Recycling and Copper Wire Manufacturing in India: Market, Supply, Imports, Costs and Outlook 2026
1. Introduction
Copper is one of the most strategically important metals for India's electrification, infrastructure, renewable energy, electric vehicles, telecommunications, construction and industrial growth. India consumed about 1.878 million tonnes of copper in FY2024-25, with secondary copper accounting for a substantial share of supply. Copper scrap is generated from discarded electrical wires and cables, motors, transformers, radiators, industrial equipment, manufacturing process waste, automobiles, construction demolition and household products. The growing demand for electrical wires, cables, EVs, renewable-energy equipment and power infrastructure is increasing the requirement for both primary copper and recycled copper. India therefore remains an important global market for copper scrap imports, while improving domestic collection and recycling could reduce dependence on imported raw material and strengthen the country's circular-economy ecosystem.
2. Copper Scrap Generation, Availability, Recycling and End Users in India
2.1 Major sources of copper scrap generation
Copper scrap entering the Indian recycling chain can broadly be divided into new scrap and old/end-of-life scrap.
a) Electrical wires & cables
- Typical copper scrap generated: Bare copper, cable offcuts, rejected cable
- Major examples: Construction, power distribution, telecom
- Principal users after recycling: Rod, wire, cable, busbar
b) Motors
- Typical copper scrap generated: Windings, copper wire
- Major examples: Pumps, motors, appliances, EVs
- Principal users after recycling: Copper rods, winding wire
c) Transformers
- Typical copper scrap generated: Copper windings, strips
- Major examples: Distribution/power transformers
- Principal users after recycling: Transformer wire, rods, strips
e) Electrical equipment
- Typical copper scrap generated: Busbars, terminals, conductors
- Major examples: Switchgear, panels, industrial equipment
- Principal users after recycling: Busbars, wires, components
f) Manufacturing process scrap
- Typical copper scrap generated: Punchings, turnings, borings, offcuts
- Major examples: Engineering and fabrication
- Principal users after recycling: Rods, billets, alloys
g) Automobile/EVs
- Typical copper scrap generated: Harnesses, motors, radiators
- Major examples: ICE vehicles and EVs
- Principal users after recycling: Copper rod, wire, alloy products
h) Radiators/heat exchangers
- Typical copper scrap generated: Copper tubes and fins
- Major examples: Industrial and automotive
- Principal users after recycling: Tubes, alloys, cast products
i) Construction & demolition
- Typical copper scrap generated: Old cables, plumbing, fittings
- Major examples: Buildings and infrastructure
- Principal users after recycling: Wire, rod, plumbing products
j) Consumer appliances
- Typical copper scrap generated: Motor windings, cables, coils
- Major examples: ACs, refrigerators, washing machines
- Principal users after recycling: Wire and copper semis
k) Industrial equipment
- Typical copper scrap generated: Coils, conductors, machining scrap
- Major examples: Factories, generators, compressors
- Principal users after recycling: Rods, wires, strips
l) Brass products
- Typical copper scrap generated: Brass scrap containing copper
- Major examples: Valves, fittings, sanitaryware
- Principal users after recycling: Brass billets and components
m) Foundry/metallurgical waste
- Typical copper scrap generated: Dross, ash, scales
- Major examples: Copper and alloy processing
- Principal users after recycling: Secondary copper/alloys
The Indian Bureau of Mines has historically noted that precise domestic copper-scrap generation is difficult to quantify because collection remains fragmented and a significant part of the sector operates through informal channels.
2.2 New scrap versus old scrap
New scrap is generated during manufacturing. Examples include:
• Wire-drawing offcuts
• Cable manufacturing rejects
• Rod and strip trimming
• Machining turnings
• Punchings
• Defective electrical components
New scrap normally has relatively high copper recovery and better traceability.
Old scrap is generated when products reach the end of their useful life:
• Old electrical cables
• Transformers
• Motors
• Automobiles
• EV components
• Appliances
• Demolished buildings
• Industrial machinery
Old scrap is more difficult to collect and sort but represents an increasingly important future source of copper.
2.3 What happens after collection?
The typical value chain is:
Scrap generator → Scrap collector → Aggregator → Sorter/processor → Recycler → Rod/billet manufacturer → Wire manufacturer → Cable/OEM manufacturer → End user
High-grade copper scrap can be directly melted, while lower-grade or contaminated scrap may require additional refining.
India's copper recycling system is still heavily dependent on direct melting, creating an opportunity for better sorting, refining and impurity-control technologies.
3. India's Copper Scrap Availability: 2024, 2025 and 2026 Outlook
A key distinction is required between domestic scrap generation, scrap available to the recycling system, and imports.
The International Copper Association India reported approximately 422 KT of copper scrap availability in FY2024 and 534 KT of copper scrap in FY2025. Secondary copper's share of India's total copper demand increased to approximately 42% in FY2025.
3.1 Estimated copper-scrap availability
- FY2024: ~422 KT (Reported industry estimate)
- FY2025: ~534 KT (Reported industry estimate)
- FY2026: ~600–610 KT (Analytical estimate)
- FY2030: ~1,350–1,410 KT (secondary copper demand, Industry projection)
The FY2026 estimate uses the approximately 13–14% projected medium-term CAGR for secondary copper demand as a planning proxy; it should not be interpreted as an official government forecast of physical domestic scrap generation.
3.2 Why scrap availability is rising
The principal drivers are:
a) Rapid growth in electrical equipment.
b) Increasing cable consumption.
c) Higher vehicle and EV penetration.
d) Growth of renewable-energy installations.
e) Expansion of data centres.
f) Industrial machinery replacement.
g) Building demolition and redevelopment.
h) Better scrap collection.
i) Formalisation of recycling.
j) High copper prices encouraging recovery.
4. India's Copper Scrap Imports and Demand
India is structurally dependent on imported copper scrap because domestic collection does not fully meet the requirements of the secondary-copper industry.
World Bank/UN Comtrade data show that India imported approximately 329,074 tonnes of copper and copper-alloy waste and scrap in calendar 2024, valued at approximately US$2.04 billion.
Government trade data for FY2024-25 put India's copper-waste-and-scrap imports at approximately US$2.234 billion, up significantly from the previous year. Saudi Arabia, the United States and Germany were among the leading suppliers.
4.1 India's major copper-scrap suppliers during FY2024-25 and the import value
I) Saudi Arabia: ~$414.8 million Major Gulf supply hub
ii) United States: ~$287.2 million Large scrap availability
iii) Germany: ~$182.5 million* High-quality industrial scrap
iv) United Kingdom: ~$167.7 million Established recycling market
v) Colombia: ~$91.7 million Growing supply
vi) UAE: ~$84.8 million Major trading/re-export hub
vii) Kuwait: ~$68.2 million Gulf supplier
viii) Australia: ~$49.2 million Established scrap market
ix) Brazil: ~$47.8 million Latin American supply
x) Italy: ~$44.0 million European industrial scrap
*Values based on trade data; exact rankings can differ between calendar-year and Indian fiscal-year datasets.
5. Major Types of Copper Scrap Demanded in India
5.1 Bare bright copper
Highest-value category because it contains very high-purity copper with minimal contamination.
Applications after recycling:
• Copper rod
• Electrical wire
• High-conductivity conductor
• Busbar
5.2 Copper wire and cable scrap
Generated from:
• Construction
• Electrical installations
• Telecommunications
• Industrial cables
• Automobile wiring
• EV harnesses
It can be mechanically stripped or processed before melting.
5.3 Copper tube and pipe scrap
Mainly generated from:
• Air conditioners
• Refrigeration equipment
• Heat exchangers
• Plumbing systems
5.4 Copper motor scrap
Recovered from:
• Motors
• Generators
• Pumps
• Compressors
• Industrial machinery
• EV traction systems
5.5 Transformer copper scrap
Includes:
• Copper winding wire
• Copper strips
• Foils
• Conductors
5.6 Brass scrap
Although technically copper alloy scrap, brass is an important part of India's secondary copper ecosystem.
It is used for:
• Valves
• Fittings
• Electrical components
• Automotive components
• Sanitaryware
• Engineering products
6. Copper Scrap Recycling: End Users and Applications
a) Copper cathode
- Major end users: Rod manufacturers
- Applications: Wire rod
b) Copper rod
- Major end users: Wire/cable manufacturers
- Applications: Electrical conductors
c) Copper wire
- Major end users: Electrical industry
- Applications: Motors, transformers, cables
d) Copper strip
- Major end users: Transformers
- Applications: Windings
e) Copper busbar
- Major end users: Electrical equipment
- Applications: Switchgear, panels
f) Copper tube
- Major end users: HVAC
- Applications: AC and refrigeration
g) Copper billet
- Major end users: Foundries
- Applications: Engineering components
h) Brass billet
- Major end users: Engineering
- Applications: Valves, fittings
i) Copper alloy ingot
- Major end users: Automotive/engineering
- Applications: Components
The copper recycling ecosystem is therefore not limited to recyclers. It supports a broad manufacturing chain extending from scrap collectors to electrical-equipment manufacturers.
7. Major Indian Copper and Copper-Wire Manufacturing Units
India's copper-wire industry consists of large integrated companies, specialist wire manufacturers and thousands of smaller regional manufacturers.
7.1 Major upstream copper producers
7.1.1 Hindalco / Birla Copper
Hindalco Industries operates major copper facilities in Gujarat.
Its reported copper capacity includes approximately:
• 420 KT copper cathodes
• 540 KT continuous-cast copper rods
In FY2024-25, copper cathode production was approximately 402 KT, while continuous-cast rod production was approximately 453 KT. Copper VAP/rod sales were approximately 394 KT.
The Dahej facility has a smelting capacity of approximately 500,000 tonnes per year, with a CC-rod capacity at the facility of about 180,000 TPA; the wider Birla Copper system has substantially higher rod capacity.
7.1.2 Hindustan Copper Limited
Hindustan Copper Limited has mining, smelting, refining and wire-rod operations.
Its downstream facilities include:
• Taloja, Maharashtra — copper wire rod facility
• Ghatsila, Jharkhand — integrated copper facility
• Jhagadia, Gujarat — secondary copper smelting/refining facility
Current operations at some smelting/refining facilities have been suspended or are limited, while Taloja is currently used for third-party tolling activities.
8. Major Indian Wires and Cables Manufacturers
- Main manufacturing footprint: Gujarat, Daman, Maharashtra and others
- FY2024-25 position: Market leader
- FY2026 direction: Capacity expansion
ii) KEI Industries
- Main manufacturing footprint: Rajasthan, DNH, Gujarat
- FY2024-25 position: Major institutional/retail player
- FY2026 direction: Sanand expansion
iii) RR Kabel
- Main manufacturing footprint: Gujarat, DNH and others
- FY2024-25 position: Major retail player
- FY2026 direction: Large W&C expansion
iv) Finolex Cables
- Main manufacturing footprint: Maharashtra, Goa, Uttarakhand
- FY2024-25 position: Major wire/cable producer
- FY2026 direction: Product and capacity expansion
- Main manufacturing footprint: Multiple Indian facilities
- FY2024-25 position: Major electrical brand
- FY2026 direction: Continued expansion
- Main manufacturing footprint: Multiple facilities
- FY2024-25 position: Strong southern presence
- FY2026 direction: Capacity expansion
vii) RR Shramik
- Main manufacturing footprint: India
- FY2024-25 position: Winding-wire specialist
- FY2026 direction: Export opportunities
viii) Bhagyanagar India
- Main manufacturing footprint: Telangana
- FY2024-25 position: Copper products/recycling
- FY2026 direction: Recycling growth
9. Major Manufacturers: Capacity and Production Indicators
A major limitation is that most large cable companies report cable/wire length or business revenue rather than copper tonnage consumed. Therefore, a direct apples-to-apples copper-wire production comparison is not possible from public annual reports.
9.1 Polycab
Polycab reported an FY2024-25 W&C revenue of approximately ?188.9 billion, with the W&C business representing about 84% of company sales. Its organised W&C market share was estimated at approximately 26–27%.
Its manufacturing capacity was reported at approximately 6 million km of wires and cables in the FY2025-26 reporting period, with capacity utilisation around 79%.
9.2 KEI Industries
KEI Industries operates multiple manufacturing facilities in Rajasthan and Dadra & Nagar Haveli and Daman & Diu.
Its FY2024-25 annual report states that the Sanand project was being developed with the first phase targeted for 2025, ultimately adding approximately ?5,500–6,000 crore of production capacity.
9.3 RR Kabel
RR Kabel reported 7% volume growth in its Wires & Cables segment in FY2024-25, with cables increasing by almost 19%.
The company planned:
• Approximately 36,000 MT additional W&C capacity at Waghodia.
• Approximately 6,000 MT additional wire capacity at Silvassa.
These investments are targeted for completion in phases through 2026–28.
9.4 Finolex Cables
Finolex Cables operates four major manufacturing plants at Pimpri, Urse, Goa and Roorkee. Its products include electrical wires, power cables, automotive cables, solar cables and other specialised products.
9.5 MSME and specialist producers
Specialist copper-wire manufacturers supply:
• Transformer manufacturers
• Motor manufacturers
• Generator manufacturers
• Cable companies
• Switchgear companies
• Electrical OEMs
• Railway equipment manufacturers
• EV component manufacturers
For example, one Indian specialist manufacturer reported combined installed capacities of 5,868 MT for bare copper wire/strips, 1,404 MT for paper-covered copper strips/wire, 1,512 MT for cable wires, and 5,760 MT for copper rods across two facilities.
10. Top 10 Indian States for Copper-Wire MSME Manufacturing
There is no comprehensive current official state-wise database measuring copper-wire MSME production. The following is therefore an indicative industry estimate based on manufacturing clusters, electrical-equipment concentration, transformer/motor manufacturing, cable activity and regional demand.
10.1 Estimated MSME copper-wire production state / region wise production
i) Gujarat
- FY2024 estimated production: 65–75 KT
- FY2025 estimated production: 72–82 KT
- FY2026 expected: 80–92 KT
ii) Maharashtra
- FY2024 estimated production: 52–62 KT
- FY2025 estimated production: 57–68 KT
- FY2026 expected: 63–75 KT
iii) Tamil Nadu
- FY2024 estimated production: 38–45 KT
- FY2025 estimated production: 42–50 KT
- FY2026 expected: 47–56 KT
iv) Karnataka
- FY2024 estimated production: 28–35 KT
- FY2025 estimated production: 31–39 KT
- FY2026 expected: 35–44 KT
v) Telangana
- FY2024 estimated production: 23–30 KT
- FY2025 estimated production: 26–33 KT
- FY2026 expected: 29–37 KT
vi) Andhra Pradesh
- FY2024 estimated production: 19–25 KT
- FY2025 estimated production: 21–28 KT
- FY2026 expected: 24–31 KT
vii) Rajasthan
- FY2024 estimated production: 17–22 KT
- FY2025 estimated production: 19–25 KT
- FY2026 expected: 21–28 KT
viii) Uttar Pradesh
- FY2024 estimated production: 15–20 KT
- FY2025 estimated production: 17–22 KT
- FY2026 expected: 19–25 KT
ix) Delhi-NCR
- FY2024 estimated production: 14–19 KT
- FY2025 estimated production: 16–21 KT
- FY2026 expected: 18–24 KT
x) West Bengal
- FY2024 estimated production: 11–16 KT
- FY2025 estimated production: 12–18 KT
- FY2026 expected:14–20 KT
Important: These figures are planning estimates rather than official state-wise production statistics. They should be replaced by company-level or MSME Ministry datasets if a regulatory/financial report requires audited statistics.
10.2 Why these states dominate
- Gujarat: copper, electrical, transformer, cable and engineering clusters.
- Maharashtra: Mumbai-Pune industrial corridor, electrical equipment, transformers and automotive manufacturing.
- Tamil Nadu: electrical, automotive, motors, pumps and industrial machinery.
- Karnataka: Bengaluru electronics, electrical, automation and industrial equipment.
- Telangana: Hyderabad electrical, engineering, infrastructure and industrial ecosystem.
- Andhra Pradesh: electrical, industrial and infrastructure manufacturing.
11. Demand for Copper Scrap in India and Dependence on Imports
India's FY2025 copper demand was approximately 1.878 million tonnes, up around 9% year on year. Secondary copper represented a significant part of this demand. The copper-wire, cable and transformer ecosystem alone accounted for a major portion of consumption.
The International Copper Association India reported (Indicator FY2025):
- Total copper demand: 1,878 KT
- Copper rod demand: 1,201 KT
- Copper scrap: 534 KT
- Local direct-melt copper: ~403 KT
- Imported direct-melt copper: ~150 KT
- Secondary copper share: ~42%
This demonstrates why imported scrap is important: India's copper-consuming industries are growing faster than domestic scrap collection in several segments.
12. Top 10 Copper-Scrap Exporting Countries
According to World Bank/UN Comtrade data for 2024, the largest exporters of HS 740400 copper and copper-alloy waste and scrap included the following.
i) United States
- 2024 export value: US$5.381 bn
- Approx. quantity: 959 KT
ii) European Union*
- 2024 export value: US$3.424 bn
- Approx. quantity: 610 KT
iii) Japan
- 2024 export value: US$2.432 bn
- Approx. quantity: 340 KT
iv) Germany
- 2024 export value: US$2.387 bn
- Approx. quantity: 403 KT
v) United Kingdom
- 2024 export value: US$1.692 bn
- Approx. quantity: 279 KT
vi) France
- 2024 export value: US$1.564 bn
- Approx. quantity: 283 KT
vii) Saudi Arabia
- 2024 export value: US$1.376 bn
- Approx. quantity: 167 KT
viii) Italy
- 2024 export value: US$1.260 bn
- Approx. quantity: 193 KT
ix) Thailand
- 2024 export value: US$1.157 bn
- Approx. quantity: 184 KT
x) Mexico
- 2024 export value: US$1.140 bn
- Approx. quantity: Quantity not reported on WITS page
*The EU is a reporting aggregate and should not be treated as a single physical exporting country.
12.1 Why these countries are important
- United States: enormous installed copper base and mature scrap collection.
- Japan: highly organised collection, sorting and quality control.
- Germany and France: strong industrial and automotive scrap streams.
- United Kingdom: mature demolition, electrical and industrial recycling markets.
- Saudi Arabia/UAE region: important trading and aggregation hubs for Middle Eastern scrap.
- Thailand: major Asian recycling and manufacturing ecosystem.
13. Copper Scrap Prices and Their Impact on Copper-Wire Manufacturers
Copper-wire manufacturers face a unique pricing problem: copper can account for the overwhelming majority of the material value of a finished conductor.
Consequently, even a small movement in copper prices can produce a large change in the absolute value of inventory and sales.
13.1 Simplified copper-wire cost formula
Finished wire cost = Copper input + conversion cost + insulation + labour + power + finance + logistics + wastage + overhead + margin
For a bare copper conductor:
Copper cost ≈ LME/MCX-linked copper price + premium − scrap discount + logistics
13.2 Example
Suppose a manufacturer has:
• Copper input = Rs1,000/kg
• Conversion and overhead = Rs80/kg
• Total cost = Rs1,080/kg
• Selling price = Rs1,120/kg
• Gross conversion margin = Rs40/kg
If copper rises 8% and the manufacturer cannot immediately pass the increase to customers:
Copper = Rs1,080/kg
Total cost becomes approximately:
Rs1,160/kg
If selling price remains Rs1,120/kg, the manufacturer moves into a loss.
This is why working-capital management, inventory hedging and price escalation clauses are critical.
13.3 How large manufacturers protect margins
Large manufacturers increasingly use:
• LME-linked pricing
• Forward contracts
• Commodity hedging
• Embedded derivatives
• Short inventory cycles
• Price escalation clauses
• Dynamic dealer pricing
• Scrap blending
Polycab specifically reported using hedging instruments and strategic pricing to protect margins from copper-price volatility.
14. Impact of High Copper Prices on Manufacturers
Positive effects
a) Higher sales value.
b) Higher working-capital turnover.
c) Greater value of recovered scrap.
d) Stronger economics for recycling.
e) Improved revenue growth when volumes remain stable.
Negative effects
a) Higher working capital.
b) Higher bank-finance requirements.
c) Customer resistance to price increases.
d) Margin compression.
e) Inventory valuation risk.
f) Increased theft risk.
g) Higher import costs.
h) Greater cash-flow volatility.
Copper prices have become particularly important in 2026 because global copper prices have reached historically high levels, increasing pressure on downstream wire and cable companies.
15. SWOT Analysis of Indian Copper-Wire Manufacturers
Strengths
- Large domestic electrical market
- Growing power infrastructure
- Strong manufacturing base
- Skilled engineering workforce
- Large organised manufacturers
- Growing export capability
- Strong demand from construction
Weaknesses
- Dependence on imported copper/scrap
- Commodity-price volatility
- Fragmented MSME sector
- Working-capital intensity
- Higher electricity costs than some Asian competitors
- Limited domestic scrap collection data
- Quality differences between organised/unorganised suppliers
Opportunities
- EV growth
- Renewable energy
- Data centres
- Grid modernisation
- Railways and metro
- Export markets
- Copper recycling
- Circular economy
Threats
- Copper-price volatility
- Cheap imports
- Global recession
- Scrap shortages
- Geopolitical disruptions
- Currency fluctuations
- Aggressive new entrants
- Environmental compliance costs
India's organised wires-and-cables market is expected to benefit from infrastructure, power, renewable energy, real estate, EVs and data centres.
16. Copper-Wire Manufacturing Cost in India Compared with Other Countries
A direct international comparison is difficult because manufacturers use different product specifications, copper grades, labour structures, electricity tariffs, financing costs and tax regimes.
The most useful comparison is therefore conversion cost, rather than the headline copper price, because copper itself is a globally traded commodity.
16.1 Indicative cost structure for 1 tonne of copper wire
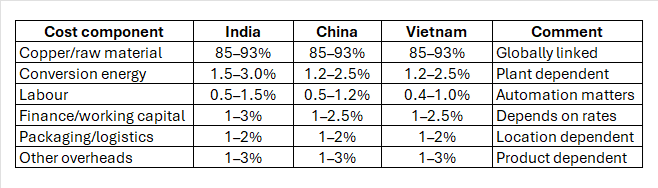 These are illustrative ranges, not quoted manufacturing tariffs.
India can be competitive in labour and conversion, but electricity and logistics remain important cost variables. NITI Aayog notes that India's commercial electricity costs can be higher than those of several Asian manufacturing peers.
At the same time, Indian manufacturers benefit from:
• Strong domestic demand
• Local engineering capability
• Proximity to customers
• Large electrical-equipment ecosystem
• Increasing automation
• Large production scale
The strategic objective should therefore be to reduce conversion cost per kg, rather than attempting to compete only through cheap labour.
17. Opportunities for Copper Scrap Traders and Wire Manufacturers
The market offers opportunities across five major areas:
17.1 Domestic scrap collection
Formal collection networks can capture scrap from:
• Construction
• Demolition
• Automotive
• Electrical equipment
• Industrial machinery
• Appliances
17.2 Imported scrap sourcing
Indian buyers can diversify sources across:
• USA
• Saudi Arabia
• UAE
• UK
• Germany
• Japan
• Australia
• Colombia
• Brazil
• European markets
17.3 Quality-based pricing
Better segregation can increase margins by separating:
• Bare bright
• No. 1 copper
• No. 2 copper
• Insulated copper wire
• Brass
• Motors
• Transformers
• Radiators
• Mixed copper scrap
17.4 Direct buyer-seller relationships
Digital B2B marketplaces can reduce information asymmetry between scrap sellers, traders, recyclers and manufacturers.
18. . Usage of LOHAA Mobile Application of Android and iPhone / Portal for Commercial Transactions for Copper-Scrap Commercial Transactions /Leads
LOHAA is a digital B2B marketplace focused on ferrous and non-ferrous metals, alloys, ores, minerals and related industrial products. Its platform is designed to connect verified buyers and sellers and facilitate domestic and international metal-trading opportunities.
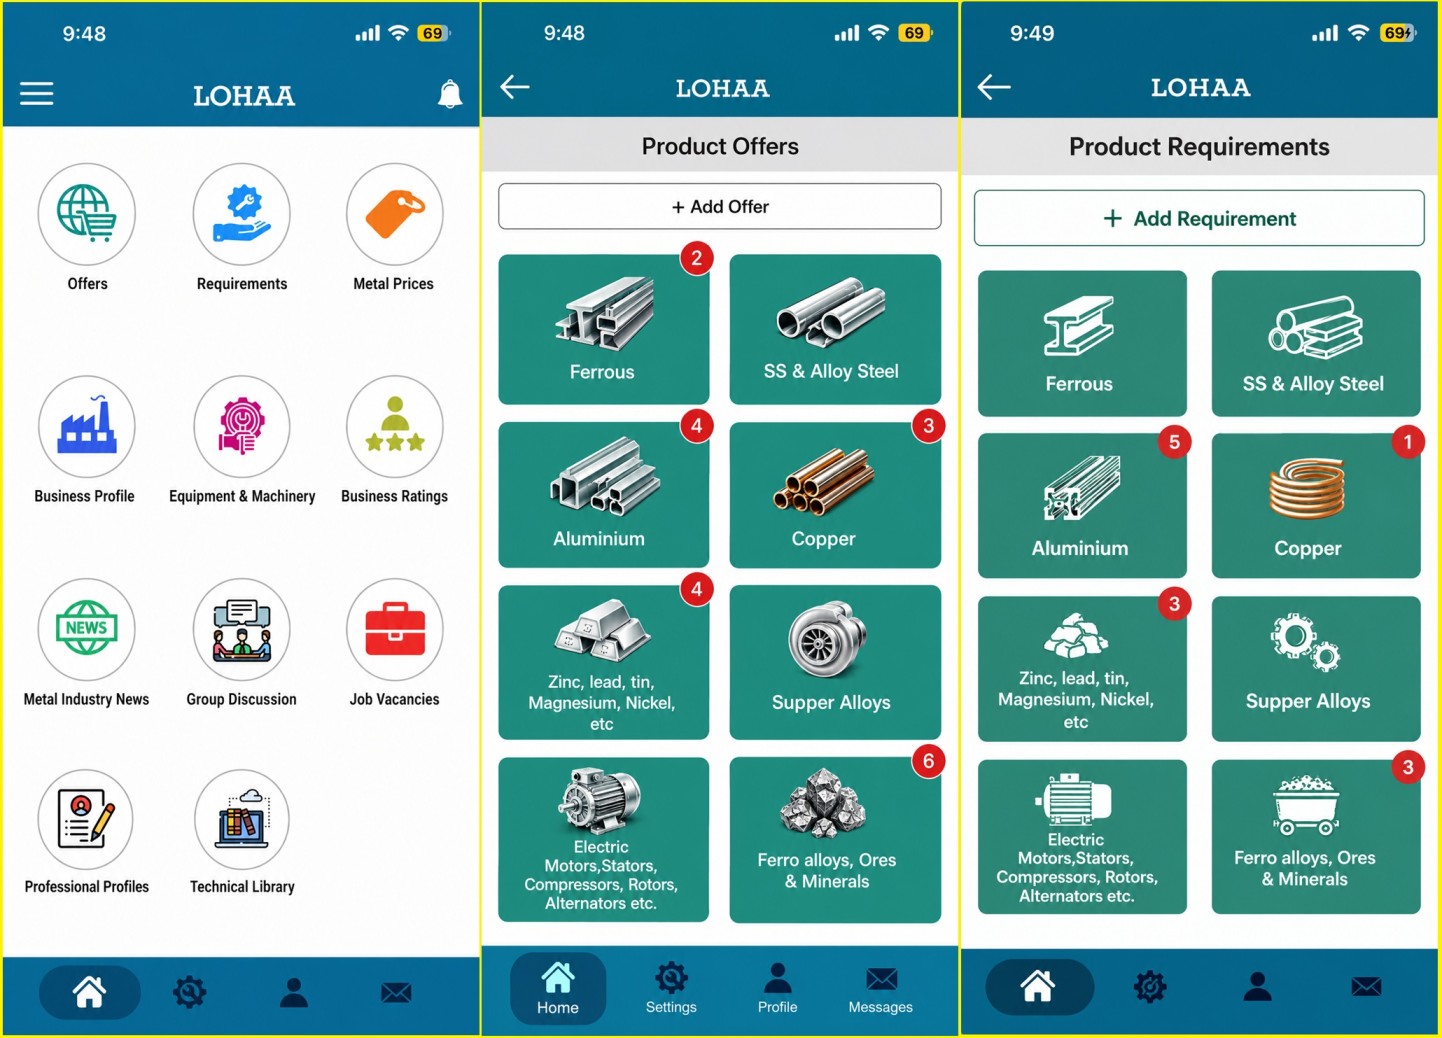
The LOHAA Mobile Application of Android and iPhone / Portal can be used by copper-industry participants for activities such as:
18.1 Finding buyers and sellers
Copper scrap suppliers can identify potential:
• Recyclers
• Wire manufacturers
• Copper rod manufacturers
• Traders
• Importers
• Exporters
• Industrial consumers
18.2 Commercial enquiries
A buyer can communicate:
• Scrap type
• Quantity
• Origin
• Location
• Specification
• Packing
• Delivery terms
• Payment terms
• Expected price
18.3 Import and export opportunities
The platform can help businesses identify potential international trading counterparties.
18.4 Verification and due diligence
LOHAA states that members are screened/vetted before joining its business network.
However, commercial users should still independently verify:
• Company registration
• GST details
• IEC
• Bank details
• Material specifications
• Inspection reports
• Previous transaction history
• Payment terms
The Google Play listing itself advises users to independently verify buyers, sellers and commercial terms before entering transactions.
18.5 Recommended digital transaction workflow
Seller lists copper scrap → Buyer discovers material → Specification discussion → Price negotiation → Inspection → Commercial terms → Purchase order → Logistics → Weighment → Quality verification → Payment → Transaction closure
This can make a digital platform such as LOHAA particularly useful for fragmented copper-scrap and MSME markets.
19. Key Market Trends for 2026–2030
19.1 Secondary copper will become more important
Industry projections indicate secondary copper demand could rise to approximately 1.35–1.41 million tonnes by FY2030, with secondary copper potentially reaching around 55% of copper demand.
19.2 EVs will increase copper intensity
Copper is required in:
• Traction motors
• Battery connections
• High-voltage cables
• Charging systems
• Wiring harnesses
• Power electronics
• Cooling systems
19.3 Renewable energy will increase copper demand
Solar and wind installations require copper for:
• Generators
• Transformers
• Inverters
• Cables
• Grid connections
• Earthing
• Power transmission
19.4 Data centres will be a major demand source
Data centres require large quantities of:
• Power cables
• Busbars
• Transformers
• Switchgear
• UPS systems
• Cooling equipment
19.5 Scrap quality will become increasingly important
As recycled content increases, manufacturers will require better:
• Sorting
• Grading
• Traceability
• Impurity control
• Refining
• Digital documentation
20. Key Tables at a Glance
20.1 India's copper market
a) Total copper demand
- FY2024: 1,718 KT
- FY2025: 1,878 KT
- FY2026 outlook: ~2,000 KT+ indicative
b) Secondary copper/scrap contribution
- FY2024: ~39%
- FY2025: ~42%
- FY2026 outlook: Rising
c) Copper scrap availability
- FY2024: ~422 KT
- FY2025: ~534 KT
- FY2026 outlook: ~600–610 KT estimated
d) Copper rod demand
- FY2024: ~1,109 KT
- FY2025: ~1,201 KT
- FY2026 outlook: Increasing
e) Scrap imports
- FY2024: >300 KT
- FY2025:~335–350 KT
- FY2026 outlook: Remains strategically important
FY2024 and FY2025 figures are based primarily on International Copper Association India and trade data; FY2026 is an analytical estimate.
20.2 Main demand sectors (Sector & Importance)
- Building & construction: Very high
- Power transmission/distribution: Very high
- Industrial equipment: High
- Consumer appliances: High
- Automotive/EV: Rapidly increasing
- Renewable energy: Rapidly increasing
- Data centres: Rapidly increasing
- Railways/metro: Increasing
- Telecommunications: Increasing
21. Conclusion
India's copper ecosystem is entering a structurally important phase in which primary copper, recycled copper and copper scrap imports will all be required simultaneously. Copper demand reached approximately 1.878 million tonnes in FY2025, while secondary copper already represented around 42% of demand. Scrap availability is increasing, but domestic collection and formal recycling capacity still need to expand to match future requirements.
For copper-wire manufacturers, the biggest challenges are copper-price volatility, working-capital requirements, scrap quality, imported raw-material dependence and intense competition. At the same time, EVs, renewable energy, power-grid expansion, data centres, railways, construction and industrialisation provide strong long-term demand.
The next stage of India's copper industry will therefore depend on better scrap collection, digital trading, quality-based segregation, efficient recycling, commodity-price risk management and higher manufacturing productivity. Digital B2B platforms such as LOHAA can support this transition by connecting verified buyers and sellers and improving commercial discovery across India's fragmented metal ecosystem.
22. References
1. International Copper Association India – India Copper Demand FY2025 — copper demand, secondary copper and scrap data.
2. International Copper Association India – FY2024 Copper Demand Study — FY2024 copper and scrap-flow data.
3. World Bank WITS – Global Copper Scrap Exports 2024 — global exporter data.
4. World Bank WITS – India Copper Scrap Imports 2024 — Indian import data.
5. Indian Bureau of Mines – Indian Minerals Yearbook — copper production and capacity information.
6. Polycab India Annual Report 2024-25 — Indian W&C market and company performance.
7. Polycab India Annual Report 2025-26 — current capacity and market outlook.
8. KEI Industries Annual Report 2024-25 — manufacturing footprint and expansion.
9. RR Kabel Annual Report 2024-25 — capacity and operational data.
10. Finolex Cables — manufacturing plants and wire/cable portfolio.
11. Hindalco Copper Business — copper cathode and rod production/capacity.
12. Hindustan Copper Limited — copper mining, refining and wire-rod operations.
13. LOHAA official platform — digital metal B2B marketplace.
14. LOHAA mobile application – Google Play — application information and transaction verification disclaimer.
Data note: FY = Indian financial year ending 31 March. KT = thousand tonnes. MT = metric tonnes. Figures identified as estimated, indicative or expected are analytical estimates rather than audited government statistics.
Frequently Asked Questions (FAQs) – Copper Scrap & Copper-Wire Manufacturing in India
1. What are the main sources of copper scrap in India?
Copper scrap is mainly generated from electrical wires and cables, motors, transformers, automobiles and EVs, construction and demolition, industrial machinery, appliances, radiators, HVAC equipment and manufacturing-process waste. Both new manufacturing scrap and end-of-life copper products contribute to the recycling stream.
2. What are the major types of copper scrap traded in India?
The commonly traded categories include bare bright copper, copper wire scrap, insulated copper wire, copper cable scrap, copper tubes and pipes, copper busbars, motor scrap, transformer scrap, copper turnings and borings, and mixed copper scrap. Brass scrap is also an important copper-alloy recycling category.
3. How much copper scrap is available in India?
Industry data indicate that copper scrap availability increased from approximately 422 KT in FY2024 to 534 KT in FY2025. Availability is expected to continue increasing as India's electrical, automotive, EV, renewable-energy and infrastructure sectors expand.
4. Why does India import copper scrap?
India's rapidly growing copper-consuming industries require more secondary copper than domestic collection can currently provide. Imports help recyclers and manufacturers obtain additional volumes, specific grades and high-quality scrap. Therefore, countries such as the USA, Saudi Arabia, Germany, UK and other major recycling markets are important suppliers.
5. Which industries are the biggest users of recycled copper?
Recycled copper is widely used to manufacture electrical wires, power cables, transformer windings, busbars, motor windings, copper tubes, automotive components, EV components and industrial products. Construction, power infrastructure, renewable energy and electrical equipment are particularly important demand sectors.
6. How do copper scrap prices affect wire manufacturers?
Copper is the largest raw-material component in many copper-wire products. When scrap or copper prices rise sharply, manufacturers face higher working-capital requirements and inventory risk. If selling prices cannot be increased quickly, their conversion margins can decline. LME-linked pricing, hedging and price-escalation mechanisms can help manage this risk.
7. Which Indian states have major copper-wire and cable manufacturing clusters?
Important manufacturing centres include Gujarat, Maharashtra, Tamil Nadu, Karnataka, Telangana, Andhra Pradesh, Rajasthan, Uttar Pradesh, Delhi-NCR and West Bengal. Gujarat and Maharashtra have particularly strong copper, electrical, engineering and wire/cable ecosystems.
8. What is driving copper-wire demand in India through 2030?
Major growth drivers include electric vehicles, renewable energy, electricity transmission and distribution, railway and metro projects, construction, industrial automation, data centres, telecommunications and appliance manufacturing. These sectors require substantial quantities of copper conductors and electrical components.
9. How can copper scrap traders find reliable buyers and sellers?
Traders should verify company registration, GST, IEC where applicable, material specifications, quantity, quality, inspection arrangements, delivery terms and payment conditions before completing a transaction. Digital B2B marketplaces such as LOHAA can help connect metal buyers and sellers and improve commercial discovery, while users should still conduct their own due diligence.
10. What is the future of copper recycling in India?
The outlook is strong. Increasing copper demand, high metal prices, EV adoption, renewable energy, infrastructure investment and the need for resource efficiency are likely to increase the importance of secondary copper. Better collection, segregation, formal recycling, digital trading and advanced refining can help India build a more efficient circular copper economy.
By using digital trade platforms like LOHAA Mobile application, you can reach global buyers, source quality material, and strengthen long-term partnerships.
Download the Lohaa Metal Trading App for Android to access live scrap prices and real-time market updates anytime, anywhere.
Download the Lohaa Metal Trading App for iOS to access live scrap prices and real-time market updates anytime, anywhere.
(Notes: market and production volume estimates are synthesized from public market reports and industrial press; exact tonne figures for materials are not centrally published in a single comprehensive public dataset, therefore the numeric projection above is a conservative, documented estimate built from available intelligence and reasonable regional share assumptions.)


