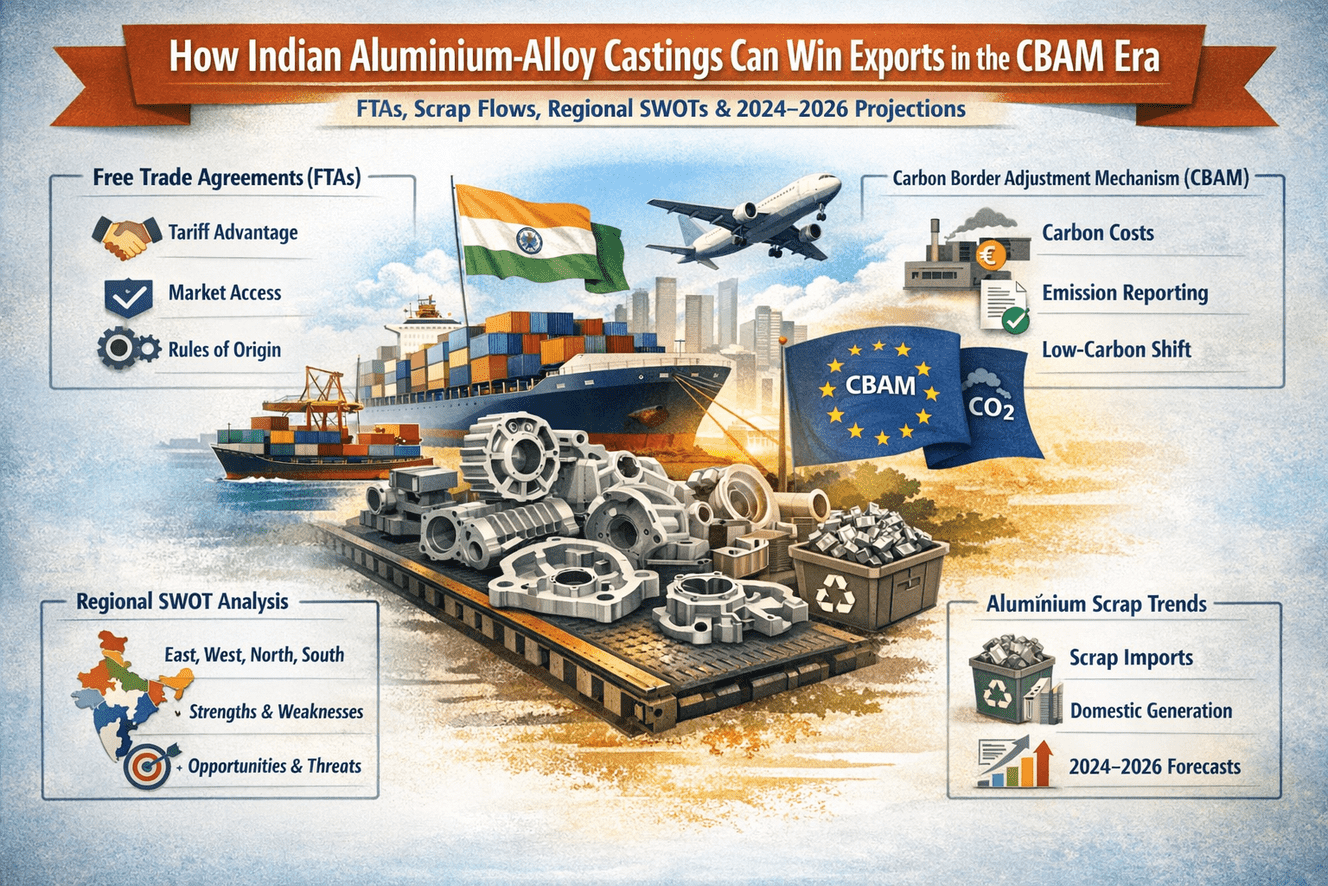
Indian Aluminum Alloy Castings Export Trends 2026 | CBAM & FTA Impact
Indian aluminium-alloy castings — export competitiveness, FTAs, CBAM effects, regional SWOTs, scrap flows & projections (deep-dive)
Executive summary (TL;DR)
Indian aluminium-alloy castings manufacturers are well placed to grow exports because of low costs, a growing domestic supply chain (auto & EV), and expanding FTAs — but they face rising global carbon rules (notably the EU’s Carbon Border Adjustment Mechanisms), supply-chain frictions for scrap feedstock, and regional gaps in infrastructure and low-cost clean power. This report:
- Reviews how FTAs help or hurt castings exporters (merits/demerits by agreement).
- Explains how the EU CBAM changes the game for low-carbon aluminium and castings entering EU markets.
- Provides regional (East / West / North / South India) SWOTs for manufacturers.
- Presents tables of regional export patterns (castings & aluminium products) and country-wise aluminium-scrap suppliers to India (2024 + projections for 2025–2026).
- Gives a transparent methodology and projections for India’s aluminium scrap generation (domestic) and for scrap imports to India (2024–2026).
- Includes SEO assets (title, description, tags) and references to source material.
Key load-bearing facts (quick, with sources)
- India imported ≈ 1.742 million tonnes of aluminium scrap in 2024 (imports valued at ≈US$3.69B / 1,741.53 kt). (GTAIC)
- Top exporters of aluminium scrap to India in 2024 (by share): USA (≈23.7%), Saudi Arabia (≈10.4%), UK (≈8.6%), UAE (≈8.1%), Australia (≈5.3%). (GTAIC market report). (GTAIC)
- India’s primary aluminium output was ~4.15 million tonnes in 2024 (major producers: Vedanta, Hindalco, NALCO, etc.). (seaisi.org)
- The EU’s CBAM applies to carbon-intensive imports (steel, aluminium, cement, etc.) and is actively affecting trade policy and compliance burdens for exporters to EU markets. (Taxation and Customs Union)
- India exported Articles of aluminium (e.g., castings) worth ~US$473M in 2024; main destinations include United States, Germany, UK, Israel, Netherlands. (COMTRADE / WITS summary for HS 761690). (World Integrated Trade Solution)
1) How FTAs affect export competitiveness for Indian aluminium-alloy castings manufacturers
Why FTAs matter (short)
Free Trade Agreements (FTAs) reduce tariffs, simplify rules of origin, and can open preferential market access for value-added products (like castings). They also often include trade-facilitation commitments (customs cooperation, SPS/TBT frameworks) that can speed shipments and lower transaction costs — a big advantage for components and precision castings where lead time and margins matter. See India’s active RTA/FTA programme. (Press Information Bureau)
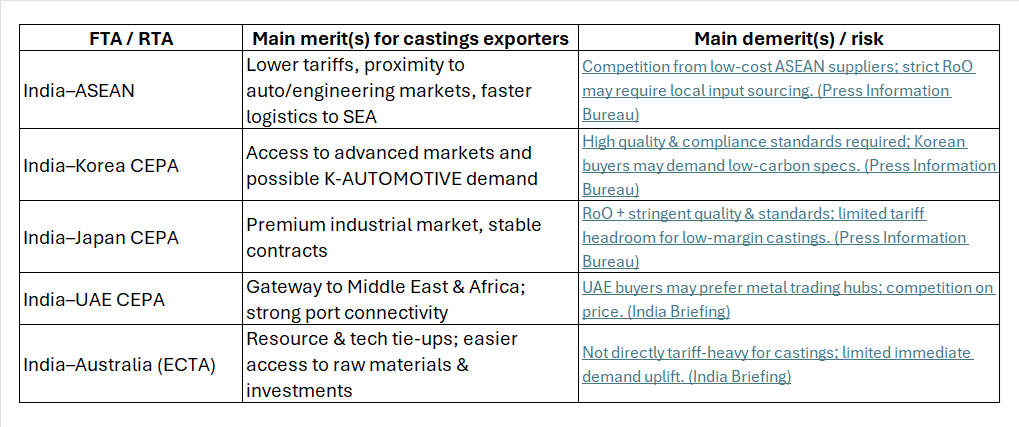
Key FTAs / RTAs relevant for aluminium castings exporters (India's existing & near-term deals)
(Selected agreements that materially affect aluminium/castings trade flows / supply chains from India)
- India–ASEAN Preferential Trade Agreement / India–ASEAN FTA — tariff concessions to ASEAN countries. (Press Information Bureau)
- India–Korea CEPA — deepened cooperation (industrial rules, services). (Press Information Bureau)
- India–Japan CEPA — tariff phasing for various industrial products. (Press Information Bureau)
- India–UAE CEPA and India–Australia ECTA — recent agreements opening Gulf / advanced market pathways. (India Briefing)
Note: India has 13+ RTAs/FTAs in force or under negotiation; refer to the Ministry of Commerce list for the latest status. (Mcommerce)
Merits (how FTAs help castings exporters)
- Lower tariffs to partner markets → improved landed price competitiveness. (Important for price-sensitive castings markets such as automotive components). (World Integrated Trade Solution)
- Preferential rules of origin (RoO) can allow Indian firms to claim preferences if sufficient local value-added is present (good for clusters with local downstream machining and finishing). (Press Information Bureau)
- Market access & services commitments (logistics, trade facilitation, dispute resolution) reduce non-tariff delays — critical for Just-In-Time automotive supply. (NITI Aayog)
- Strategic tie-ups — FTAs often come with investment provisions and supply-chain integration incentives (helps tech transfer and access to lower-carbon inputs).
Demerits / risks (what FTAs can expose or not solve)
- Rules of Origin complexity — castings frequently use imported raw materials (e.g., alloying elements, specialty scrap). Strict RoO can make it hard to claim preferences unless manufacturers localize upstream inputs. (NSE India Search Archives)
- Exposure to competition — lower tariffs cut both ways. Imports of finished castings/parts from lower-cost FTA partners (e.g., some ASEAN or China via indirect routes) can increase competitive pressure. (Volza)
- Non-tariff regulatory alignment — FTAs do not guarantee alignment on environmental standards; rising carbon rules (CBAM-style) can add cost even with tariff preferences. (Taxation and Customs Union)
- Limited coverage — many FTAs don’t address sectoral decarbonisation incentives (renewable energy access for energy-intensive smelting), leaving producers exposed to higher carbon-related costs.
Practical takeaway for castings exporters: FTAs improve price competitiveness where RoO can be met locally — but to fully benefit, manufacturers should (a) localize critical upstream inputs where possible; (b) improve traceability (to meet origin & carbon evidence); and (c) plan for non-tariff compliance (technical standards, carbon reporting).
2) CBAM (EU Carbon Border Adjustment Mechanism) — what it means for Indian aluminium-alloy castings exporters
Short description
The EU’s CBAM introduces a carbon-price adjustment on imports of carbon-intensive products, including aluminium and certain downstream goods, to avoid carbon leakage and level the playing field for EU producers. Importers must declare embedded emissions and surrender CBAM certificates equal to the carbon price avoided. This raises compliance, reporting and potential cost burdens for foreign exporters to the EU. (Taxation and Customs Union)
Direct impacts on castings exporters
- Compliance & documentation burden: exporters (or their importers) must provide robust GHG accounting for aluminium used (primary vs. secondary, electricity grid emission factors, process emissions). Firms with poor traceability face default high emission factors and higher CBAM payments. (Financial Times)
- Price pressure in the EU market: unless producers can demonstrate low-carbon aluminium (e.g., smelters powered by renewables, or high share of secondary aluminium), castings exported to the EU will cost more or lose competitiveness. (European Aluminium)
- Upside for low-carbon exporters: producers that can demonstrate low embedded carbon (green power for smelting, secondary aluminium usage) may gain an edge — preferential sourcing by EU buyers seeking low-carbon supply chains.
Indirect impacts (global)
- Scrap flows & competition for secondary aluminium: CBAM and EU scrap-export controls may cause shifts in global scrap flows. The EU has been considering tighter controls on scrap exports to retain feedstock for its decarbonisation and recycling targets — this could tighten global scrap availability and raise prices for countries like India that import scrap. (Reuters reporting). (Reuters)
- Need for investments: firms may need investments in carbon accounting systems, low-carbon power procurement (e.g., corporate PPAs), and/or shift to higher share of secondary aluminium to remain competitive in EU value chains. (NITI Aayog)
Recommendation: exporters targeting EU markets should immediately (1) map their aluminium supply chain emissions, (2) improve traceability of scrap vs primary aluminium, and (3) explore renewable energy procurement or partnerships to reduce the CBAM burden.
3) FTAs — merits & demerits (compact table)
4) India — regional SWOT for aluminium-alloy castings manufacturers
For each region we focus on manufacturing clusters, logistics, skills, power access, and export orientation.
West India (Gujarat, Maharashtra, parts of Rajasthan)
Strengths
- Large export hinterland (ports like Mundra, Nhava Sheva), strong chemicals & engineering clusters (Gujarat leads chemicals exports). (The Times of India)
- Established foundry & auto component clusters (Pune, Manesar/Mumbai belt). (bizongo.com)
Weaknesses
- Variable access to low-cost renewable power in some pockets; higher logistics congestion for inland transport.
Opportunities
- Proximity to Middle East & EU shipping routes; scope to build value-added casting + machining + surface finishing clusters for export. (NITI Aayog)
Threats
- Competition from lower-cost ASEAN producers; rising raw-material costs and tighter global scrap availability (EU export controls). (Reuters)
South India (Tamil Nadu, Karnataka, Andhra Pradesh, Telangana)
Strengths
- Strong auto & EV components cluster (Chennai, Hosur, Coimbatore); skilled castings workforce; port access (Chennai, Ennore, Mangalore). (alucast.co.in)
- Growing high-value machining & die-casting capability (important for aluminium alloy components). (sofeast.com)
Weaknesses
- Some states face power procurement challenges for large-scale low-carbon smelting (but many secondary/indirect opportunities in castings). (NITI Aayog)
Opportunities
- Exports to USA, EU, and ASEAN; EV supply-chain growth can spur demand for precision castings. (Fastmarkets)
Threats
- Need to meet stringent environmental reporting (CBAM) for EU-bound parts; competition for scrap feedstock from other regions. (Taxation and Customs Union)
North India (U.P., Haryana, Delhi NCR, Punjab)
Strengths
- Large manufacturing base near NCR; good domestic market demand; logistics corridors (road/rail). (NSE India Search Archives)
Weaknesses
- Fewer deep-sea ports; sometimes higher land logistics costs for exports.
Opportunities
- Closer to heavy engineering and defence supply chains; potential for specialised industrial castings.
Threats
- Competition for skilled labour; environmental compliance costs for larger smelters/processors.
East India (Odisha, West Bengal, Chhattisgarh, Jharkhand)
Strengths
- Proximity to raw materials (bauxite), large primary aluminium capacity (e.g., Odisha, Chhattisgarh). (UJA)
- Closer to major primary smelters — potential feedstock & integration opportunities. (International Aluminium Institute)
Weaknesses
- Port bottlenecks in some corridors; need for value-addition clusters for castings rather than just raw/primary exports.
Opportunities
- Integration with primary producers (forward integration into casting & extrusion for exports); decarbonisation roadmaps with NITI Aayog/Ministry support. (NITI Aayog)
Threats
- Energy costs and grid emission intensity could penalize exports under CBAM unless low-carbon measures are implemented.
5) Regional export tables — aluminium articles & castings (2024 snapshot)
Below are regionalized (by India region) export summaries for Articles of aluminium / castings and Aluminium & articles thereof — compiled from COMTRADE / WITS / OEC aggregated data (2024). These tables show main destination countries (useful to prioritize markets & compliance strategy).
Data note: product-level export data for HS codes 761690 (Articles of aluminium, nes, e.g., castings) and HS 76 (Aluminium & articles). Values are 2024 calendar-year / source: WITS / OEC / COMTRADE country breakdowns. (World Integrated Trade Solution)
Table A — Articles of aluminium (castings) — top export destinations (India overall, 2024)
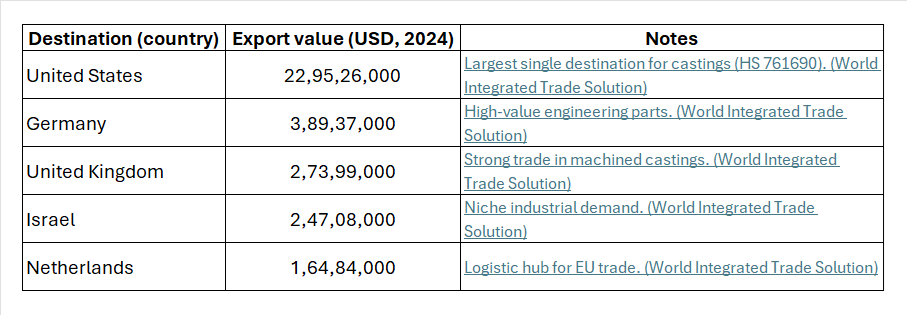 Table B — Regional exporters (by Indian region) — indicative distribution of castings & aluminium article exports (2024)
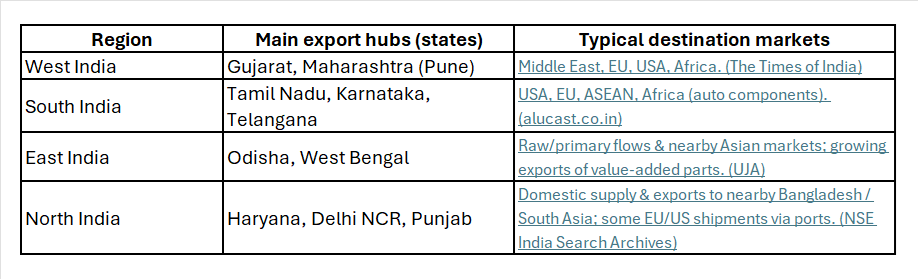
Practical export strategy by region: West & South are priority regions for export-led castings firms (ports, clusters, OEM base). East has raw-material advantage if firms integrate forward into value-added castings. North is best for engineering/defence niche supplies.
6) India aluminium scrap — actuals (2024) and projections (2025–2026)
Important: data for imports is fairly well documented; data for domestic scrap generation (post-consumer + new scrap) is more fragmented. Below I present
(A) documented import figures,
(B) a transparent estimation of domestic scrap generation with assumptions and projected values for 2025–2026.
All assumptions are shown so you can audit or change them.
A — Documented scrap imports to India (observed 2024)
- Imports (HS 7602): ≈1,741.53 kt in 2024 (US$ ≈ 3.686B). India accounted for ≈15.6% of global aluminium scrap imports in 2024. Source: GTAIC / market reports. (GTAIC)
B — Domestic scrap generation: methodology & assumptions
Goal: produce reasonable projections for India’s domestic aluminium scrap generation (calendar years 2024, 2025, 2026). Because official, consolidated numbers for domestic aluminium scrap generation by year are not publicly and consistently published, we estimate using the following transparent approach:
Assumptions
- India primary aluminium production (2024) ≈ 4.15 Mt (primary production), which correlates to overall aluminium consumption with imports/exports. (seaisi.org)
- Secondary / scrap share in supply: industry sources (Alucast, MRAI) indicate India is heavily reliant on scrap imports and domestic generation historically supplies a small fraction of scrap demand (estimates vary; earlier item: 85–90% scrap demand met via imports in FY2022). We'll conservatively assume domestic scrap generation supplied ≈10–15% of national scrap demand in 2024. (alucast.co.in)
- Domestic scrap growth: as consumption and collection systems improve, domestic scrap generation will grow faster than primary production — assume 8% CAGR year-on-year for 2024→2026 (reflecting improved collection, EV & auto sector growth, and MRAI/industry initiatives). This is directional and can be adjusted.
Calculation (estimates)
- If total aluminium apparent consumption in India in 2024 ≈ 4.5 Mt (industry estimates of consumption around 4.5 Mt in 2024–2025), then domestic scrap generation (10% share) ≈ 450 kt in 2024. (We cite consumption estimates as ranges; see UJA/industry notes). (UJA)
Applying 8% CAGR:
- 2024 (estimate) — Domestic scrap generation ≈ 450 kt (note: rough estimate; domestic collection systems historically weak). (alucast.co.in)
- 2025 (proj.) — 450 * 1.08 = ≈486 kt.
- 2026 (proj.) — 486 * 1.08 = ≈525 kt.
Why these are plausible: industry commentary (Alucast, MRAI) cites rising domestic scrap but still heavy import dependence; a moderate 8% recovery in domestic supply is reasonable if collection & sorting investments increase. (alucast.co.in)
C — Imports to India — projection (2024–2026)
We take documented 2024 imports = 1,741.53 kt (GTAIC). For 2025/2026 projections we combine reported LTM data and observed trends (2025 early months show volatility, but the market regained momentum in late 2025). We'll use a conservative growth path:
- 2024 (actual): 1,741.53 kt. (GTAIC)
- 2025 (proj): assume a net +3–5% uptick for full year 2025 as the market adjusted and demand increased — ≈1,800 kt (rounded). (GTAIC LTM Jan–Oct 2025 figures indicate recuperation). (GTAIC)
- 2026 (proj): assume continued moderate growth +5% on 2025 → ≈1,890 kt.
Table — Scrap supply to India (kt) — actuals & projections

7) Country-wise aluminium-scrap exporting to India — 2024 & projections
2024 baseline (GTAIC market share, US$ terms / converted to shares) — top exporters to India (2024, share in India’s imports by value):
- United States: ≈ 23.7%. (GTAIC)
- Saudi Arabia: ≈ 10.4%. (GTAIC)
- United Kingdom: ≈ 8.6%. (GTAIC)
- United Arab Emirates: ≈ 8.1%. (GTAIC)
- Australia: ≈ 5.3%. (GTAIC)
(Other suppliers include Netherlands, Spain, Singapore, Canada, depending on year.)
Projections method: apply projected total imports (1,800 kt in 2025 and 1,890 kt in 2026) and assume small share shifts driven by geopolitics & EU scrap-export controls (which may reduce EU → Asia flows slightly). We'll assume the USA maintains/increases share modestly; EU/UK/Canada shares could shrink slightly if EU starts restricting scrap exports; Middle East/SEA share may rise.
Table — Country-wise scrap exports to India (kt) — 2024 actual & projected 2025–2026 (approx.)
Converting shares to kt for clarity (using 2024 import volume = 1,741.53 kt).
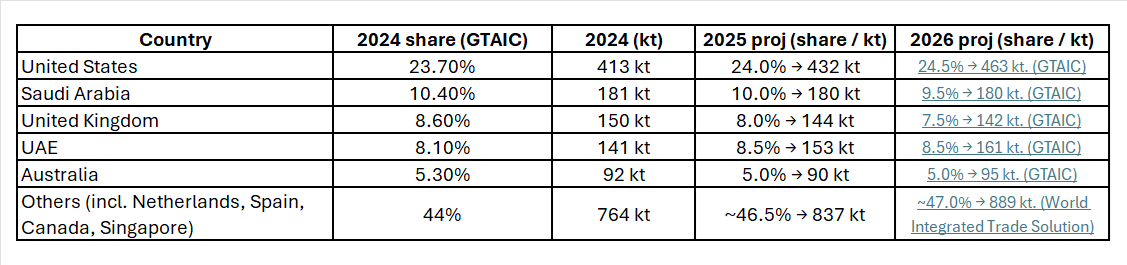

Notes & reasoning
- The US is likely to remain the largest supplier given its large scrap availability and established trade flows (Al Circle & trade reports). (alcircle)
- If the EU introduces stricter export controls on aluminium scrap (as reported), EU/UK shares could be pressured downward — we model a small decline for UK/EU-sourced scrap. Reuters reported EU preparatory steps in late 2025. (Reuters)
8) Practical recommendations for Indian aluminium-alloy castings exporters
- Map carbon & origin data now. For EU markets ensure traceability of aluminium feedstock (primary vs secondary, electricity emission factors). This reduces CBAM default risk. (Taxation and Customs Union)
- Target FTA markets where RoO can be satisfied. West & South clusters should prioritize markets accessible via FTAs (ASEAN, Korea, Japan, UAE) while ensuring local value-addition to meet RoO. (Press Information Bureau)
- Invest in low-carbon electricity procurement (PPAs, captive renewables) for integrated producers or find low-carbon aluminium suppliers to reduce CBAM burden. NITI Aayog & Ministry roadmaps support such actions. (NITI Aayog)
- Secure diversified scrap supply - long-term contracts with US, Gulf, Australia suppliers; and invest in domestic collection/sorting to reduce import dependence (MRAI and industry initiatives). (alcircle)
- Quality & process compliance — raise QA/QC to match EU/US tolerances (metallurgical certifications, particulate emissions control), and use trade facilitation measures in FTAs to expedite shipments. (World Integrated Trade Solution)
By using digital trade platforms like LOHAA Mobile application, you can reach global buyers, source quality material, and strengthen long-term partnerships.
Download the LOHAA Mobile application today and connect with verified scrap suppliers and manufacturers.
9) References (sources used)
a) GTAIC — Supplies of Aluminium Scrap in India: LTM (Nov-2024) (market report summary, imports 2024 = 1,741.53 kt). (GTAIC)
b) WITS / COMTRADE export breakdown — Articles of aluminium (e.g., castings) exports by country (HS 761690) — India, 2024. (World Integrated Trade Solution)
c) International Aluminium Institute — Global aluminium cycle & statistics (IAI AluCycle). (alucycle.international-aluminium.org)
d) European Commission — Carbon Border Adjustment Mechanism (CBAM) overview. (Taxation and Customs Union)
e) Financial Times — EU CBAM adjustments & international response (coverage & context). (Financial Times)
f) Reuters — EU considers restrictions on aluminium scrap exports (Nov 2025) (potential impact on scrap flows). (Reuters)
g) SEASI / industry news — India primary aluminium production 2024 (≈4.15 Mt). (seaisi.org)
h) Alucast / industry magazines & MRAI — Recovery & recycling industry context in India (collection rates, import dependence). (alucast.co.in)
i) NITI Aayog / Ministry of Mines — Roadmap for aluminium sector decarbonisation & vision documents. (NITI Aayog)
j) OEC / Trendeconomy — Bilateral trade overviews for aluminium & scrap (global flows, top importers / exporters). (OEC World)
(Notes: market and production volume estimates are synthesized from public market reports and industrial press; exact tonne figures for aluminum production are not centrally published in a single comprehensive public dataset, therefore the numeric projection above is a conservative, documented estimate built from available intelligence and reasonable regional share assumptions.)