Indian Copper Cable Market Forecast 2026: Demand, Scrap Trends
1. Executive Summary: The Copper Inflection Point
As we move into 2026, the Indian copper cable industry has shifted from a traditional commodity sector to a high-tech strategic vertical. Driven by a "perfect storm" of rapid urbanization, a multi-gigawatt renewable energy transition, and the explosive rise of the Electric Vehicle (EV) ecosystem, copper demand in India is projected to hit an unprecedented high.
While the global market anticipates a deficit of over 150,000 metric tonnes in 2026, India is positioning itself as both a massive consumer and an emerging manufacturing hub, aiming to bridge its domestic production gap through massive capacity expansions and a revolution in copper recycling.
2. Present Status: Production vs. Consumption (2025-26)
The Indian copper market is currently characterized by a "structural deficit." Despite being one of the world's fastest-growing economies, India relies on imports for nearly 90-95% of its copper concentrate requirements.
Market Drivers for 2026-2027
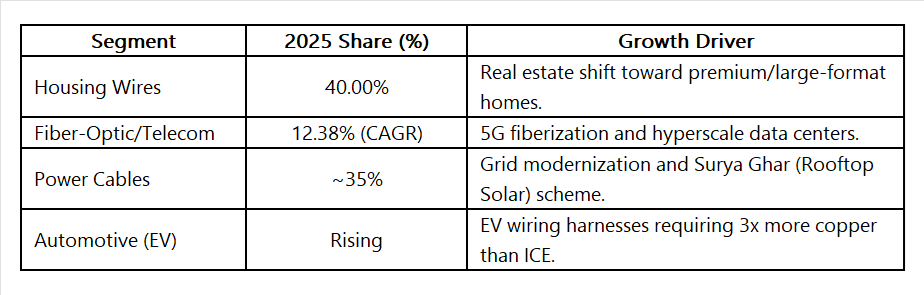
• Household Application: The "Housing for All" initiative and a 75% growth in luxury housing have increased the demand for high-quality, fire-retardant (FR) copper wires.
• Industrial Application: Modernization of the Indian Railways (electrification of 126,000+ km of tracks) and the expansion of the Data Center industry (AI-driven infrastructure) are the primary industrial volume drivers.
• Electric Vehicles (EVs): By 2027, EV sales in India are expected to reach a 15-20% penetration rate. An average EV requires 83 kg of copper compared to only 23 kg for an internal combustion engine (ICE) vehicle.
3. Market Demand & Forecast (2026-2031)
The Indian wire and cable market is projected to reach approximately $23.13 Billion in 2026, growing at a robust CAGR of 9.01% to cross $35 Billion by 2031.
4. Present Status:
Production and Demand Dynamics
As of the fiscal year 2024-25, India’s copper market has witnessed a surge in demand, primarily driven by the National Infrastructure Pipeline (NIP) and the aggressive 500 GW Renewable Energy target for 2030.
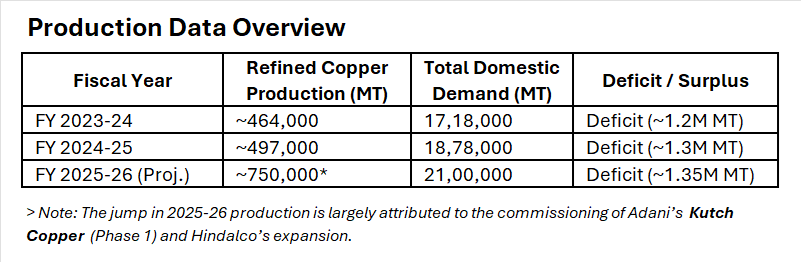
Key Production Data (FY 2024-25 Estimates)
The industry has seen a steady rise in refined copper production, though it still lags behind the astronomical growth in consumption.
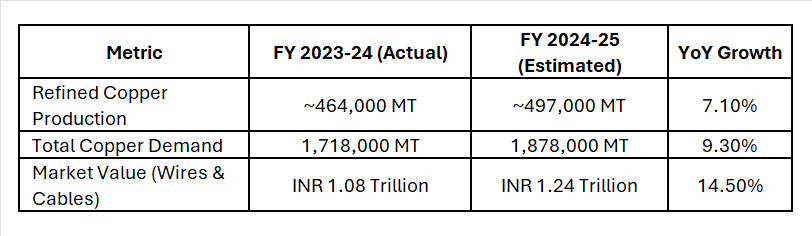
Despite the growth in domestic output, the closure of key smelting units in previous years continues to leave a "production-consumption gap" of over 1 million metric tonnes, making India heavily reliant on external supply chains.
5. Copper Scrap & Imports:
The Circular Economy Shift
With primary copper production in India remaining stagnant (meeting only about 15-20% of demand), the "Secondary Copper" or scrap market has become vital.
Scrap Availability
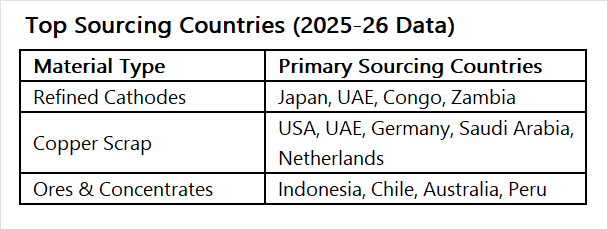
Domestic Shortfall: While recycling is increasing, domestic scrap collection is unorganized. Prices for No. 1 Copper Scrap (Millberry) have surged to over ?800/kg in major hubs like Chennai and Ahmedabad.
Import Reliance: India is becoming a net importer of copper scrap to feed its secondary smelting units.
Top Sourcing Countries (2025-26 Data)
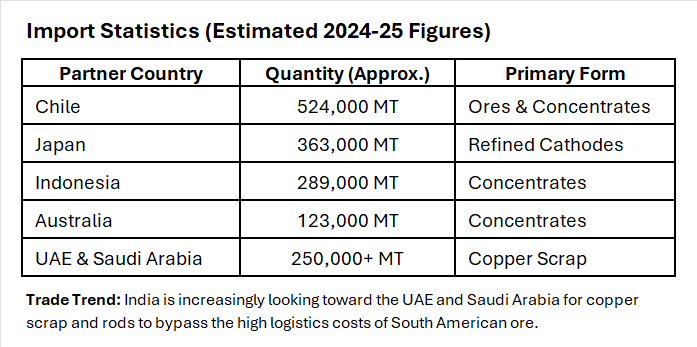
6. Global Imports: Country-Wise Breakdown
To sustain its cable manufacturing, India remains one of the world's top three copper importers.
7. Domestic Raw Material Availability
India’s domestic copper mining remains a bottleneck. While the country is rich in iron ore and bauxite, copper ore reserves are concentrated in specific belts, and extraction hasn't kept pace with demand.
a) Mining Hubs: Primary domestic sourcing is restricted to the Singhbhum belt (Jharkhand), Khetri (Rajasthan), and Malanjkhand (Madhya Pradesh).
b) The Critical Mineral Status: In 2024, the Indian government officially classified copper as a "Critical Mineral." This has streamlined permitting for new mines and encouraged private participation.
Secondary Copper (Recycling): A major shift in 2025-26 is the focus on Circular Economy. Scrap recycling now accounts for nearly 20-25% of the domestic supply. Large players like Hindalco are investing heavily in e-waste and scrap processing facilities to recover copper, reducing the need for virgin ore.
8. Regional SWOT Analysis (North, East, West & South)
a) North India (The Infrastructure Hub)
• Strengths: High concentration of residential and commercial real estate projects (NCR region); strong presence of medium-scale wire manufacturers in Rajasthan and Haryana.
• Weaknesses: Distance from major ports increases logistics costs for imported raw materials.
• Opportunities: The "Smart Cities" projects and the expansion of the Delhi-Mumbai Industrial Corridor (DMIC).
• Threats: High competition from unorganized local players offering low-quality, non-ISI marked wires.
b) East India (The Resource Powerhouse)
• Strengths: Proximity to primary copper mines in Jharkhand; abundance of low-cost labor; home to major PSUs like Hindustan Copper Ltd.
• Weaknesses: Lagging industrial infrastructure compared to the West; slower adoption of high-tech cable manufacturing.
• Opportunities: Growing demand from the electrification of the Eastern Dedicated Freight Corridor.
• Threats: Regulatory and environmental hurdles in mining operations; political sensitivity in mining belts.
c) West India (The Manufacturing Giant)
• Strengths: Coastal advantage for easy imports (Gujarat/Maharashtra ports); state-of-the-art smelting plants (Hindalco in Gujarat, Taloja in Maharashtra).
• Weaknesses: High land and operational costs in industrial zones like Mumbai and Pune.
• Opportunities: Rising demand for EV charging infrastructure and the presence of the largest automotive clusters.
• Threats: Vulnerability to global LME (London Metal Exchange) price fluctuations due to high import volume reliance.
d) South India (The Tech & Renewable Center)
• Strengths: Leading region for Solar and Wind energy projects; high demand for specialized "Green Cables"; presence of tech hubs like Bengaluru and Hyderabad.
• Weaknesses: The lingering impact of the Sterlite Copper plant closure in Tamil Nadu, which shifted the region from a producer to a consumer.
• Opportunities: Expansion of data centers (requiring massive quantities of instrumentation cables) and the Bengaluru-Chennai industrial corridor.
• Threats: Stringent environmental activism that can delay new manufacturing setups.
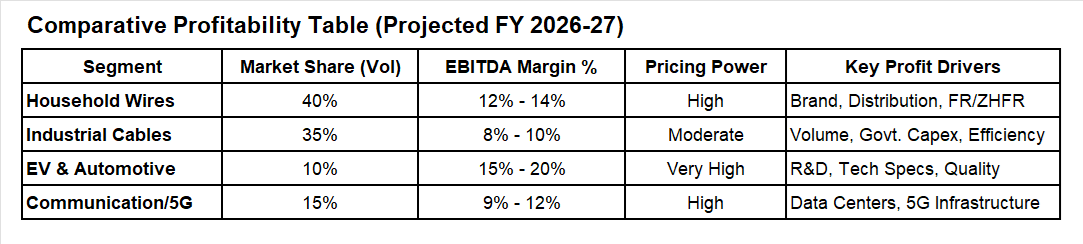
9. Profit Margin Analysis: Segment-Wise (2026-2027)
The industry's overall EBITDA (Earnings Before Interest, Taxes, Depreciation, and Amortization) margin typically fluctuates between 8% and 14%. However, these figures vary drastically across applications based on pricing power, brand loyalty, and technical complexity.
a) Household & Residential Segment (Retail Wires)
i) Average EBITDA Margin: 11% – 14%
ii) Status: This is the most profitable segment for branded players (Polycab, Havells, RR Kabel).
iii) Dynamics: Margins are driven by brand premium and a robust dealer-electrician network. Despite high competition, companies can pass on copper price hikes to retail consumers more easily than in large industrial contracts. In 2026, the shift toward Fire-Resistant (FR) and Zero-Halogen (ZHFR) wires is allowing for a "premiumization" of margins.
b) Industrial & Infrastructure Segment (Power & Project Cables)
i) Average EBITDA Margin: 7% – 10%
ii) Status: High volume, but lower percentage margins due to the tendering process.
iii) Dynamics: These are often B2B or Government contracts (Railways, Metro, Utilities). Profitability depends on operational efficiency and inventory management. Because these are fixed-price or long-term contracts, sudden spikes in LME copper prices can "squeeze" margins if price variation clauses (PVC) are not robust.
c) Electric Vehicle (EV) & Specialty Segment
i) Average EBITDA Margin: 15% – 20%
ii) Status: The "High-Growth, High-Margin" frontier for 2027.
iii) Dynamics: EV wiring harnesses and high-voltage charging cables require specialized insulation and high-purity copper. Since fewer players have the technical certification (IATF 16949) for automotive grades, they command a significant price premium. Backward integration into copper recycling—a core focus for LOHAA—is a key strategy here to boost margins by reducing raw material costs by 3-5%.
10. Future Prospects (2026–2030)
The outlook for the Indian copper cable industry is exceptionally bullish, with an expected CAGR of 9-14% over the next five years.
a) 5G and Beyond: The rollout of 5G and the subsequent need for high-speed data transmission will skyrocket demand for specialized copper-based data cables and fiber-optic hybrids.
b) Electric Vehicles (EVs): An EV requires $3\times$ to $4\times$ more copper than a traditional internal combustion engine. As India aims for 30% EV penetration by 2030, the automotive wiring harness market is set to explode.
c) Modernization of Railways: The "Kavach" safety system and the transition to high-speed rail (Namo Bharat) require thousands of kilometers of signal and power cables.
d) Export Potential: With the "China Plus One" strategy, India is emerging as a preferred export hub for copper cables to the Middle East, Africa, and Southeast Asia.
Conclusion
The Indian copper cable industry is no longer just a commodity sector; it is a strategic asset. While the reliance on imports remains a challenge, the government's focus on critical minerals and the industry's pivot toward recycling are building a more resilient ecosystem. For stakeholders in the LOHAA community, the message is clear: the future is conductive, and it is made of copper.
By using digital trade platforms like LOHAA Mobile application, you can reach global buyers, source quality material, and strengthen long-term partnerships.
Download the LOHAA Mobile application today and connect with verified scrap suppliers and manufacturers.
11. References
- Ministry of Mines, Govt. of India (Copper Annual Report 2025-26).
- International Copper Association (ICA) India, Annual Demand Study.
- Directorate General of Commercial Intelligence and Statistics (DGCIS).
- SMM (Shanghai Metals Market) Review of Wire and Cable Industry.
- CSEP (Centre for Social and Economic Progress) India Copper Report.
(Notes: market and production volume estimates are synthesized from public market reports and industrial press; exact tonne figures for production are not centrally published in a single comprehensive public dataset, therefore the numeric projection above is a conservative, documented estimate built from available intelligence and reasonable regional share assumptions.)